Sonoma County Breeding Bird Atlas
The Breeding Bird Atlas maps are now complete. Click on MAPS to go to the map page.
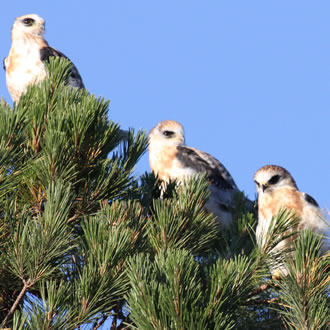
Fledgling Kites, photo by Tom Reynolds.
"Many Madrone members are familiar with the Breeding Bird Atlas, and quite a few of them have participated in the surveys, but some members may not know what an Atlas is, so a brief history and description is in order. Atlas surveys have been conducted in Britain and parts of the United States since the late 1970's. The purpose of an Atlas is to acquire baseline data on the species of birds that breed in a certain area; in our case, Sonoma County. As with other Atlases, the entire county was divided into five kilometer (about three miles) square blocks in the 1980's in preparation for our first Atlas, for which the breeding bird survey work was completed between 1986 and 1991."1
It took four more years for the data from this first Atlas to be compiled and printed in book form. Click here for a pdf copy of the original report
"The 1995 Breeding Bird Atlas (BBA) proved to be a remarkably useful and important baseline for the status of our birds. Government agencies and companies who were responsible for developing environmental impact statements and reviews warmly welcomed our BBA. Which birds breed in Sonoma County, where and by inference what habitats they use were all included in the Atlas and were of vital importance in establishing a baseline for reference. Contractors and others involved in disturbance of possible breeding habitats have been able to avoid legal challenges and public relations problems by avoiding disruption of active nests through use of the dates of active breeding data included for each bird in the BBA."2
The beginnings of the Second Breeding Bird Atlas
Pacific-slope Flycatcher nest, credit: G Beebe
One of the main values of an atlas is the possibility of comparing this baseline data with data from future studies. At its September 1992 meeting, the North American Ornithological Atlas Committee (NORAC) recommended repeating atlas studies every 25 years. Madrone members took that suggestion to heart, and started the second Atlas in 2011, completing it in 2016.
We are working on publishing the data from the second Atlas, but there is still a lot of work to be done. Not only are we working on publishing the results, but we will also be comparing the results with the first Atlas. This is no easy task, as there are many differences between the two surveys. A lot has happened in the last 25 years. Sonoma County's population in 1991 was 397,937. In 2015, it had grown to 500,292, an increase of over 125%. This increased population pressure and subsequent development has affected native species that reside in the county by reducing the habitat available to many of them for feeding and nesting. Other factors, such as the recent drought, climate change, new introduced species, and others, all have an effect on the birds that we know and love.
We can look at some figures from both Atlases to get an idea of some of the changes, but first, a note of caution: at the moment, comparing the two survey results is a bit like comparing apples and oranges (or Kinglets and Vireos, if you prefer). Both are similar, but there are differences that need to be factored in. In the first survey, there were 105 volunteers who spent 3,962 hours out in the field in the Atlas blocks, observing all of the birds they saw during the breeding season. In the second survey, there were 106 volunteers (some of them participated in both surveys), who spent 8,989 hours in the field, well over twice as many hours! Somehow, that will need to be adjusted for, as more time spent in the field usually (not always) leads to more observations, so it can look like we actually found more birds breeding, when what really happened was we had more time to find the ones that were already there.
Confirming a species
Nestling Flycatchers, credit: G Beebe
A good example of this is the number of species confirmed as breeding birds. By the way, we had a very specific protocol for determining whether a bird was actually breeding or not. It may seem obvious, but just seeing a pair of birds of the same species together, or even seeing them mate, does not itself confirm breeding. They might be in the final stages of spring migration, leaving the county before finally settling down to nest. We need to find an active nest, or see parents carrying food, or feeding the young, for example, for it to be confirmed as a breeding bird. With that in mind, we confirmed 148 species in the first survey. By the end of the second survey, we had confirmed 161 species. Does this mean that birds are doing better in the county, since more species have been found, or is it simply that because we spent so many more hours looking, we were bound to find some new species?
One thing the Atlas does not tell us, is much of anything about numbers of birds. We do know, for example, that Bushtits were confirmed in 137 blocks, out of 195 blocks surveyed, but it doesn't tell us how many Bushtits were in each block. So we can only infer from the data that roughly 137 pairs of Bushtits, and potentially their offspring, were in the county. Certainly, there are more Bushtits in Sonoma County than that! To learn more about population density, we need to look at other data collected during the same time period, such as the Christmas Bird Counts, and the huge data mine known as eBird.
Examples from Napa-Solano Audubon Society's Breeding Bird Atlas
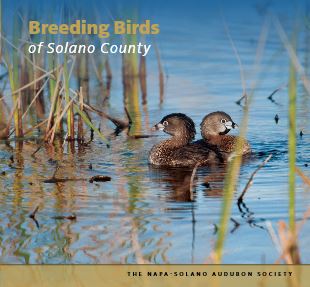
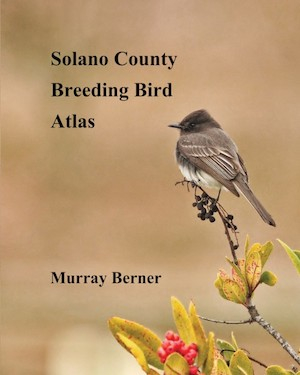
Breeding Birds of Solano County
2014 Edition: This coffee table edition begins with a carefully researched and illustrated section on the geography and habitat types within Solano County. This is followed by a larger section describing all the nesting bird species. One page is dedicated to each species, with a detailed county map showing breeding locations, interpretive text, and beautiful original color photographs by local photographers. Click on the photo at right to go to Napa-Solano's website where you can view sample pages.
2015 Field Edition: Detailed accounts for all 147 breeding species in the county, describing current and historical distribution, habitat, conservation, and population trends; an introduction to the biogeography of Solano County, and individual maps for every breeding species, by Murray Berner. Dimensions: 8 x 10 inches; 198 pages. Click on the photo at right to go to the Blurb.com website where you can view sample pages.
1
Adapted from the lead article in the Summer 2017 issue of Leaves.
2From an article the November 2010 issue of Leaves.
Find us on Facebook 
It's Nesting Season: trim trees in the Fall!.
Amazon Smile: donate to Madrone when you shop
Birding Quiz - test your skills.
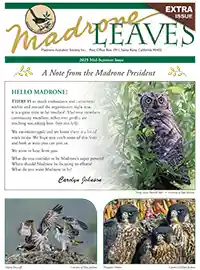
Leaves Newsletter
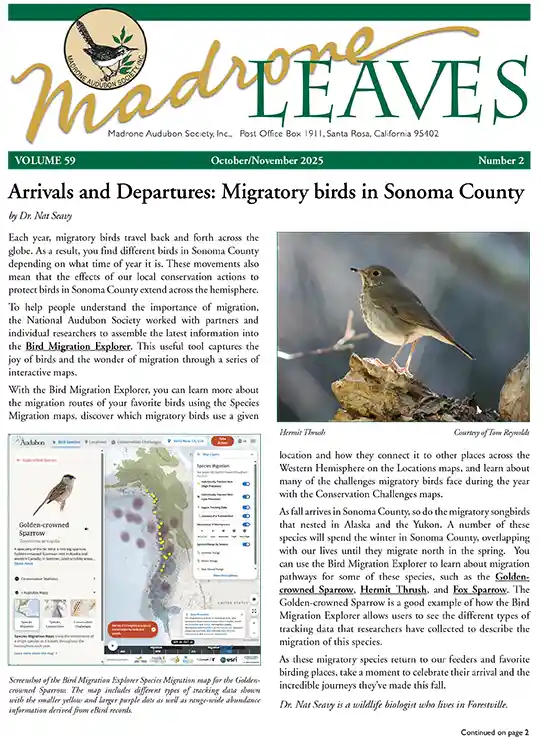
Carved Bird Pins
In the 1970s, member Tom Olds hand-carved bird pins and sold them to raise money for Madrone Audubon. More
